Lesson 9: Bias Detective
Lesson 9: Bias Detective
Objective
You will learn how to use simulations to detect biased probability.
Vocabulary
bias
Essential Concepts
Lesson 9 Essential Concepts
In the short term, actual outcomes of chance experiments vary from what is "ideal." An ideal die has equally likely outcomes; but that does not mean we will see exactly the same number of one-dots, two-dots, etc. every time we roll the die.
Lesson
-
Refer back to the tweet you completed for homework after Lesson 8. Compare your tweet to the concept of probability described below:
Probability is the measure of how often something occurs in the "long run."
Does your tweet include this description? If necessary, rewrite your tweet so that it contains this description.
-
In the previous lesson you were introduced to the concepts of chance, probability, and simulations. We use simulations so that we can use the calculated sample proportions to estimate probabilities of real life events.
-
In today’s lesson, you will learn about how probability and simulations can be used to determine if an event is not fair (for example, when a coin is weighted and therefore lands on heads more often than tails).
-
Think about what you know about dice (number cubes). A die (a single number cube) is a 6-sided cube. Each face of the cube is labeled with dots to represent a number between 1 and 6. For example, if theface has 3 dots, then it represents the number 3. A fair cube is weighted so that there is an equal probability of rolling each of the six numbers.
-
In your IDS Journal, answer this question:
What would you expect the probability of rolling the number 1 should be if a die were tossed into the air and allowed to fall back to the ground (or table)? Remember, the measure of probability is a proportion that can be expressed as a fraction, decimal or percent.
Since there are 6 numbers on the die, each number should be equally likely to occur, so the probability of rolling a 1 is 1/6.
-
In your IDS Journal, make a table with 6 columns labeled with the numbers 1, 2, 3, 4, 5, and 6. Title the table Number Cube Roll Results. Each column represents the numbers of a six-sided die (number cube). You will be tallying the results of tossing two dice (number cubes) under each number in the column.
-
Since you will be rolling two online dice 6 times, there will actually be 12 rolls for our sample. Before you roll the dice, answer the following questions:
-
If you are rolling the dice 6 times, how often will the die on the left roll a 3? Would you expect it to be same for the die on the right?Out of 6 rolls, we would expect to see each of the numbers one time, so we will most likely see about one 3 for the die on the left.
-
Would you expect the dies on the right to roll a 3 just as often? Why? Yes, we should expect the same thing from the die on the right because we have independent events. There are actually two ways that independence plays a part here: (1) each student is independent from the other and has no effect on what the other will roll, (2) the 6 die rolls for the die on the left are all independent of each other because each face of the cube has an equal chance of happening on any given roll. So, if the die on the left shows a 3 during the first roll, that doesn’t give us any information about what will happen on the second roll.
-
Since you will do a total of 12 rolls (12 samples), how many tally marks should you expect under each column on you table? We would expect to see 2 tally marks in each column (each number will probably be rolled twice).
-
-
To roll the dice, visit http://onlinedicefree.com/#dice. Click on Roll Die. Then, make sure you select 2 on the dropdown menu asking "How many die?"
-
Roll the two dice the once. Record the results of each die on your table. For example, if the die on the left shows two dots, put a tally mark in the column under number 2 and if the die on the right shows 6 dots, put a tally markin the column under the number 6. Repeat this 5 more times for a total of 6 rolls.
-
Analyze the results shown on your table after the 6 rolls by answering the following questions:
-
Do the data from these 12 rolls match what we expected (see responses from Step 8)? Is this surprising? We would expect to see 2 tally marks in each column (each number will probably be rolled twice)..
-
If the data do not match our expectations, does this mean the dice are unfair in some way? Even if they don’t match our expectations, this does not mean the dice are unfair – we simply don’t have enough data yet to know. We would need to roll the dice more.
-
If you had a real die (number cube) with you and purposefully wanted to create an unfair die, what are some ways you could do that?Answers will vary by class. Some examples include: (1) We could add tape to one face of the die to give that side more weight. This would increase the chances of the number that is directly opposite of it appearing because the die will land on the heavier side more (and therefore the side facing up will the be number opposite). (2) We could chip the edge of one corner of the die. This would throw off the original balance and favor certain sides.
-
-
Similar to the previous day’s lesson with coin flipping, you can also simulate dice rolls in RStudio. The function required is called roll_die(). The arguments for this function are a bit different than the rflip() function from yesterday. You cannot simply put roll_die(1) for the computer to roll a die one time. Instead, the function was built with 2 possible dice to choose from – die A and die B.
-
One die in the function is fair and the other has been created with bias. You will attempt to determine which die is the biased one by doing multiple simulations. They will attempt to determine which dice is the biased one by doing multiple simulations.
-
Many simulations require multiple functions, or code, to perform. This is where RScripts are helpful. An RScript can be used to test code, write notes, and let us easily execute multiple lines of code at one time. To open a new RScript, click on the icon with the green plus sign under File. Then select New RScript. Once the RScript opens, click on the blue save icon to save it. When prompted, name your new RScript roll_die. Type the function below on your RScript, then click Run. Clicking Run automatically pastes the code onto the console (the pane where you would type your code):
> roll_die(“A”, times = 1)
-
The output will show one number that represents what value on the die the computer rolled. Go back to your script and modify the function to roll die A 12 times.
> roll_die(“A”, times = 12)
-
Compare the results of these 12 simulated rolls to the results of the 12 actual rolls completed in Step 9. If there is space available in the table, you can add the computer results to it for an easy comparison.
-
If you wanted to roll a die 100 times:
-
How can you record the data?
-
How do you think RStudio count the simulation results?
-
-
RStudio's tally ( ) function will count the number of times each value on the die appears in a simulation. To make using the tally() function easier, you should assign a name to each simulation so you don’t have to type the entire function multiple times. You can also have it calculate the proportions for each value. Add the functions below to your RScript and run them one at a time.
> sample1 <- roll_die(“A”, times = 100)
> tally(sample1)
> tally(sample1, format = “proportion”)
-
Remember that if the die is fair, then the each side of the die should appear roughly the same amount of times. Therefore, the proportions should be fairly similar to each other and to the true probability of 1/6.
-
In your IDS Journal, make a sketch of what you think the histogram will look like as a result of rolling a die 100 times. Then add the function below on your RScript, then click Run. The argument nint = 6 tells R to include 6 bars in the histogram:
> histogram(sample1, nint = 6)
Note: You can save comments or notes in your RScripts to remind you about your code by including a hashtag (#) at the beginning of the note. Data scientists refer to these as "code comments", or just "comments". See image below.
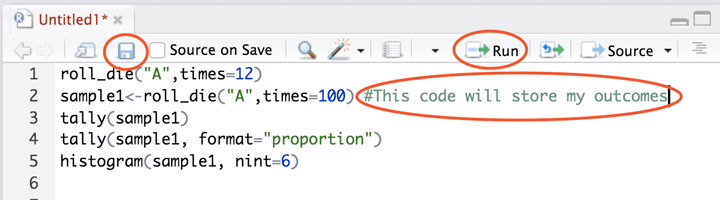
The RScript will be stored in the files tab. To run each function individually, place your cursor on the line and hit the Run button. To run multiple lines of code at once, highlight them and hit Run.
-
Now you will become a bias detective by running a simulation of die B. Use your RScript to write and run your code. Begin by rolling die B 100 times. Make a tally and a histogram for this roll. Compare the results of this roll with the results in step 12. As you compare them, notice any similarities or differences. Notice if you can tell which die is biased (unfair) yet. Write down you noticing about the die A and die B rolls in your IDS Journal.
-
You will repeat rolling die B at least 4 more times by changing the number of times RStudio rolls the die. Tally and make a histogram each time you change the number of times you roll the die. The goal is for you to determine which die is biased (unfair).
-
You will now make a decision. Which die is biased? Does the biased die tend to favor one of the outcomes (numbers)? If so, which one? Repeat rolling die B at least 4 more times by changing the number of times RStudio rolls the die. Tally and make a histogram each time you change the number of times you roll the die. The goal is for you to determine which die is biased (unfair). Below are the histograms of die A and die B rolled 2000 times.
Which one is the biased die? How do you know?
As you saw in step 22, sample sizes affect the results. Die B is biased; die A is fair. Die B favors the number 3.
The sample size needed to be large because the difference between the probabilities of the die rolls was very small. In order to detect small differences, you must have larger sample sizes.
Reflection
What are the essential learnings you are taking away from this lesson?
Homework
Imagine you had a four-sided die and rolled it 20 times. You should sketch a histogram of (a) the ideal, expected outcome, (b) an outcome that you think is “realistic,” and (c) an outcome you might see if the die were biased to produce more 4’s.