Lesson 1: What is Your True Color?
Lesson 1: What is Your True Color?
Objective
You will collect data that might tell you about your personality type, and you will understand how to subset data.
Vocabulary
subsets
Essential Concepts
Lesson 1 Essential Concepts
The "typical" value is a value that can represent the entire group, even though not all members of the group share the same value.
Lesson
-
Consider the following questions:
-
How well do you know yourself?
-
How well do you know the people around you?
-
-
There are things people know and don't know about themselves and others. The True Colors Personality Test claims to identify personality types. You will use a group of students' personality data to explore fundamental statistical concepts.
Click on the document name to download a fillable copy of the True Colors Personality Test (LMR_2.1).
-
Take the True Colors Personality Test. You will see five rows across, each containg four sets of words. For each row, read each set of words, then rank each of the four word sets using the numbers 1-4. The group of words that best describes you should get a 4. The next closest group of words will get a 3, and so on until each one of the four boxes has a number. Do the same for the rest of the rows.
Caution: Be sure to read the information on the first page and the instructions on the second page very carefully. Do not add the scores by column! Note that there is a letter at the top of each set of words (A, B, C, D, etc.). At the bottom of the page you'll see a color-coded set of fields (Orange, Gold, Blue, Green) and a set of letters in each. Add the numbers in the cells that correspond to those letters and enter the total in the correct field at the bottom of the test.
-
You should now have a score for each of the four colors. Record each color and its respective score in your IDS Journal. The color with the highest score describes your strongest personality traits (if there are two colors with tied with the highest score, choose one and do the same if there are other ties). We can refer to this as your predominant personality color. Circle your predominant personality color in your IDS Journal as well. You will find out the description of each color later on in this lesson.
-
A group of students took the personality test, and they were all asked to gather in a different corner of the classroom by their personality color. Which group would you join based on your personality color?
-
Based on the data in item #5, record answers to the following questions in your IDS Journal.
-
How many students in the class had the same predominant personality color as you?
-
What was the predominant personality color in that class?
-
-
Common characteristics of a group of people help you answer the question "What is typical?" A characteristic may be considered "typical" even though it is not shared by every single person in that group. Think about the characteristics of your personality by answering the questions below in your IDS Journal:
-
What are your likes and dislikes?
-
What are your favorite activities?
-
Are you a morning person or do you prefer to work later in the day?
-
Most of the time, do you prefer to be around lots of people or very few people?
-
How do you describe yourself?
-
-
The document below provides the description of each personality color. Remember that the highest score is considered your predominant color and the second highest score is considered your secondary color. If there was a tie for your predominant or secondary colors, you circled one of them. Now that you've read the descriptions, you might think the other color describes you better. If that's the case, make that change in your IDS Journal. How does your personality color description compare to how you described yourself in #7?
-
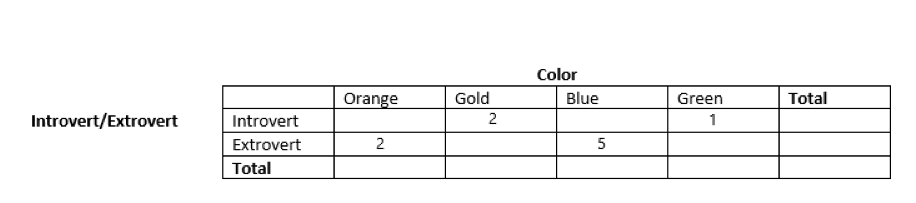
The students were then asked to gather into two subsets: introvert and extrovert. Subsetting is another way to organize collected data.
-
The students in the class in item #5 were asked to gather according to their preference into two subsets: introvert and extrovert.
-
A useful way of analyzing data is to create visuals of subsets. Now that you've completed the two-way frequency table, sketch two bar graphs of the personality colors: one for introverts and the other for extroverts.
-
Using the bar graphs you created as reference, and complete the following sentences in your IDS Journal:
-
The distribution of colors for extrovert is _______.
-
The typical extrovert in this class has _______ as their predominant personality color.
-
There is more variability in the distribution of _______ as compared with _______.
-
The predominant personality color for a typical introvert in this class is _______.
-
-
Using the two-way frequency table as reference, you will sketch two new bar graphs. One will be of your predominant color and the other of another color of your choice. Each bar graph will show the distribution of introvert and extrovert designations.
-
Using the two new bar graphs you sketch in item #13, analyze and interpret them by answering the following questions in your IDS Journal:
-
Which variables are being shown in each graph?
-
What information about each subset can I gather from each graph?
-
What do I see more of/least of?
-
What statement can I make from each of these graphs?
-
-
Go back and look at the data from the class in item #5. Then reread the description of each personality color.
-
In your IDS Journal, write a paragraph explaining what the typical person in the class in #5 is like. Remember to use the data to justify your explanation.
-
For fun: Think about a person who you believe you know really well. Which color do you predict is that person's predominant color? Ask that person to describe themself to you. Does your color prediction match how that person describes themself?
-
You will now record your own data by completing the Personality Color campaign on the IDS UCLA App or via web browser at https://tools.idsucla.org.
Reflection
What are the essential learnings you are taking away from this lesson?