Lesson 3: Data Structures
Lesson 3: Data Structures
Objective
You will learn that data can be represented in rectangular format.
Vocabulary
variables, categorical variables, numerical variables, data table, rows, columns, rectangular or spreadsheet format, variability
Essential Concepts
Lesson 3 Essential Concepts
Variables record values that vary. By organizing data into rectangular format, we can easily see the characteristics of observations by reading across a row, or we can see the variability in a variable by reading down the column. Computers can easily process data when it is in rectangular format.
ATTENTION
For every single lesson:
Answer the questions in red font in your Introduction to Data Science (IDS) Journal.
Lesson
-
During the previous lesson, you briefly learned what variables are. Create your own definition of the term “variables.”
-
Using the Stick Figure information from Lesson 2, come up with a set of variable names that describe the different categories of Stick Figure information. It is best when variable names are short (1-3 words).
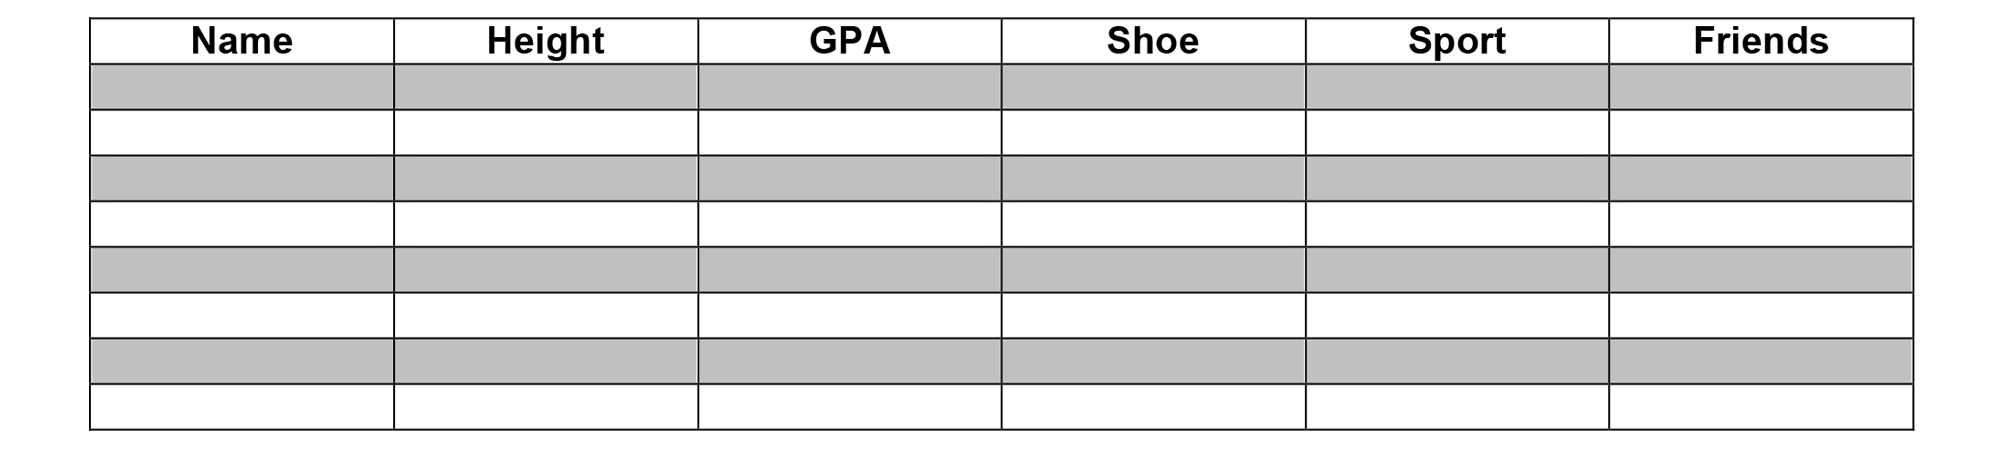
How do your Stick Figure variable names compare to ours (Name, Height, GPA, Shoe or Shoe Type, Sport, Friends, or Number of Friends)?
-
How are the values from “Shoe” different than the values from “Height”?
-
The “Shoe” variable consists of categories or groupings, and the “Height” variable consists of numbers. Therefore, we can classify variables into two types: categorical variables and numerical variables. Typically, categorical variables represent values that have words, while numerical variables represent values that have numbers.
Note: Categorical variables can sometimes be coded as numbers (e.g., “Gender” could have values 0 and 1, where 0=Male and 1=Female).
-
What variables from the Stick Figures data are numerical variables? What variables are categorical variables?
-
Although we can understand many different representations of data (as you saw in the posters from Lesson 2), computers are not as capable. We need to organize data in a structured way so that a computer can read and interpret them.
-
One way to organize the data is to create a data table that consists of rows and columns. We can define this type of organization as rectangular format, or spreadsheet format.
-
On the table below, the columns are the vertical portions of the table, while the rows are the horizontal portions. Another way to think of it is that columns go from top to bottom, and rows go from left to right. Each row should represent one observation, such as a Stick Figure, and each column should represent one variable, such as height.
-
For the table above:
-
What should each row represent?
-
What should each column represent?
-
-
Copy the table below:
-
Complete the table using all 8 of the Stick Figures cards. Each row of the table should represent one person on a card.
-
Answer the following questions:
-
Do any of the people in the data have the same value for a given variable? In other words, does a value appear more than once in a column? Give two examples.
-
Do any of the people in the data have different values for a given variable?
-
-
In the table you created, the values for each variable vary, or change, depending on which person we are observing. For example, the values for the variable GPA are not the same for all of the Stick Figures. This shows that the data has a lot of variability for the variable GPA. The first step in any investigation is to notice variability.
Reflection
What are the essential learnings you are taking away from this lesson?